One Step Further (ICT Integration)
ICT resources for science teachers
Plotting and charting experiment data
As a science teacher you and your learners will be conducting many experiments and recording data. Use Microsoft Excel to enter the data, make calculations using scientific formulae and plot charts.
You can copy and paste both the data and the charts into Microsoft Word as you create worksheets, tests and exam papers.
By the end of this activity you could achieve the following outcomes:
- Use formulae in a spreadsheet
- Plot a graph in a spreadsheet
- Devise a set of questions that you would ask learners as they learn scientific principles using the spreadsheet
2 hours
Follow these steps to complete this activity. Look for contexts that are meaningful to you in your classroom.
| Description | Resources | |
| 1 | Work in pairs (45 min)
Plotting the data By way of introduction we will examine an example of plotting ticker timer data. The data in Table 1 below represents results from a ticker timer experiment to investigate the displacement-time relationship for uniform linear motion. The table contains data that is going to be used to explore the relationship between displacement and time. The numbers shown in red have been calculated using a spreadsheet. 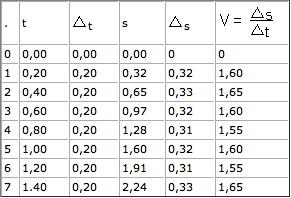
Table 1: Displacement time relationship Complete the table in the spreadsheet by making use of spreadsheet formulae as suggested in the worksheet |
» How to use autofill » How to write formulae » How to copy and paste between applications » Click here to open the example worksheet on ticker timer data |
| 2 | Work in pairs (45 min)
Charting the data
|
» How to draw a chart » How to draw a line graph » How to draw a graph with more than one series » Click here to see a copy of what the graph should look like |
| 3 | Work in groups of 4 (30 min)
|
|
| 4 | Work on your own (between workshops)
Think about the various data that you collect in science classes. Write down some ideas about how you could use the spreadsheet to plot and chart the data. Then write down some questions that you would ask the learners to help them understand the principles being illustrated by the data and chart. |
|
| 5 | Community of teachers
Join the Partners in Learning Network and find a community of teachers online. |
» Go to the Partners in Learning Network |