|
COMPUTER
SKILLS AND TIP SHEETS |
MS
Word 2000 - Graphs - Creating a graph  |
|
|
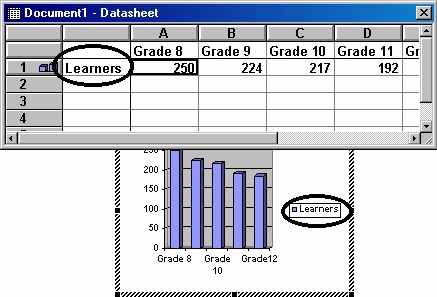
In this example we will create
a graph showing the learners in the different grades in the
school.
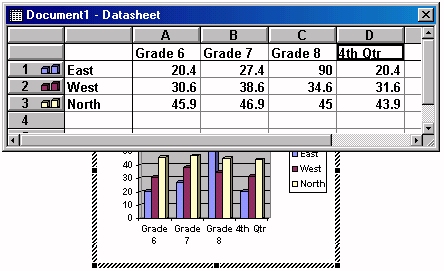
In the first row below the
headings A - D, enter the names of the grades.
Watch what happens to the graph
as you enter data into the datasheet.
As we only have one set of data, click on the 2 and press
Delete.
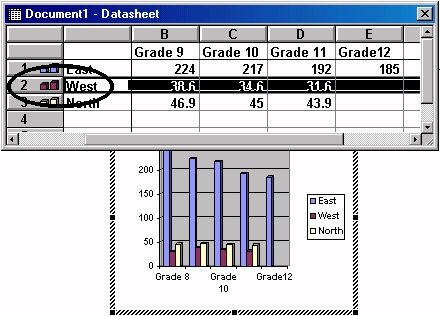
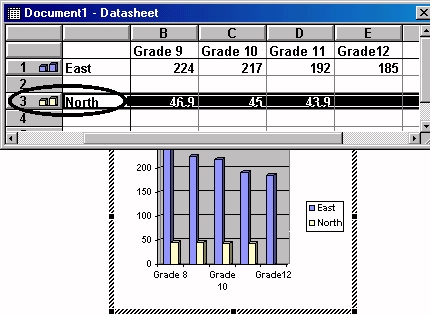
Do the same with the 3. Watch
what happens to the graph.
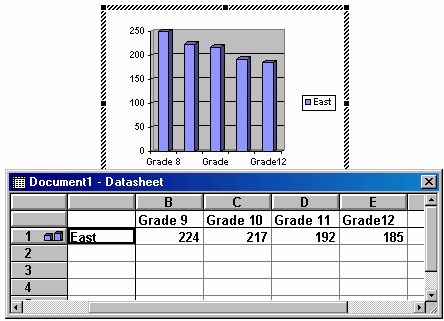
Replace the word East with Learners. Watch what happens
to the graph.
When you have finished adding your data click outside the
datasheet. The datasheet disappears and you are left with
the graph.
To return to the graph to make alterations, double click inside
the graph area.
Note the graph when you have two kinds of data.

|
|
|