|
COMPUTER
SKILLS AND TIP SHEETS |
MS
Word 2000 - Graphs - Inserting a graph  |
|
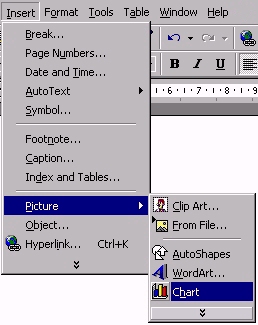
To insert a graph or chart in a Word
document
Click Insert on the menu bar. Click Picture,
then Chart.
or
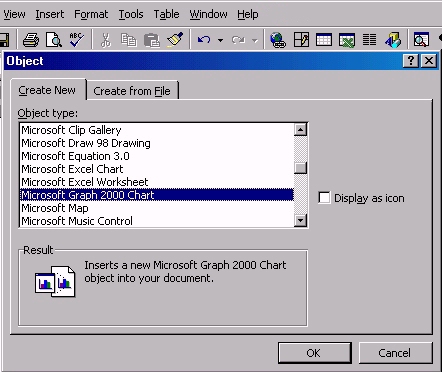
Click Insert on the menu bar. Click Object,
then Create New, then Microsoft Graph 2000 Chart.
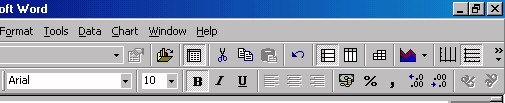
Note the new toolbar.
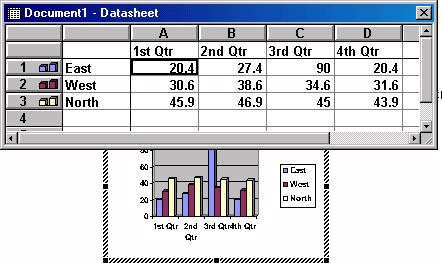
A graph is created. You
must change the labels (names) and values (numbers) in the
table to create your own graph.
|
|
|