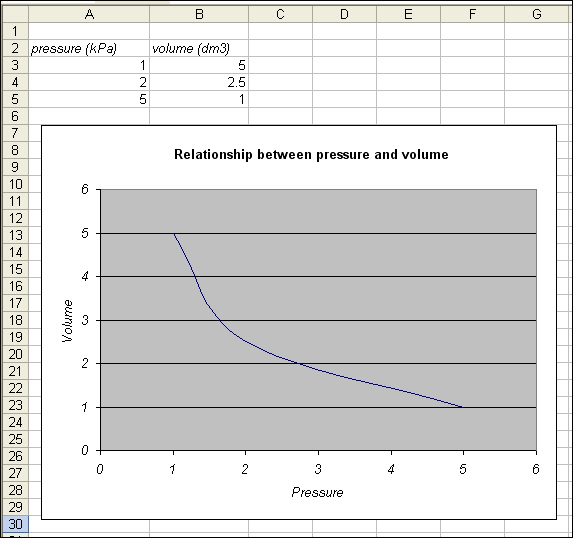
This example will plot a line graph of the relationship between pressure and volume. You can apply the same procedure to any line graph of your choice.
1. Enter data into an excel spreadsheet.
NB: decimals must be written with points (.), NOT commas (,).
2. Select the data.
3. Click on the Chart Wizard icon.
4. Select XY (Scatter).
Note: Although you are drawing a line graph, it is most effective to select XY (Scatter) for this purpose.
5. Select the desired Chart sub-type.
Note: You can view a sample of your chart by pressing the mouse button on the Press and Hold to View Sample button.
6. Click on Next.
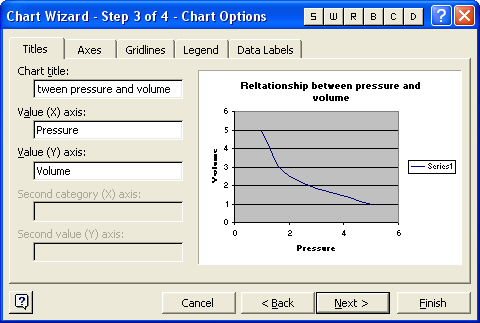
7. Enter the chart title and labels for the x and y axes
8. Click on Finish.
The
Educators' Network
Copyright
SchoolNet SA and
SCOPE. All Rights Reserved.