|
Microsoft Map displays geographical data
and values in a map. Computer mapping helps you visualize
and analyse your data.
- A graph displays data in columns.
- Microsoft Map displays data graphically
in a map.
Maps are created within Excel. Maps
made with Microsoft Map can be copied and pasted into Microsoft
Word, PowerPoint and FrontPage. The Microsoft Map feature
was first introduced in 1995 and is still little known.
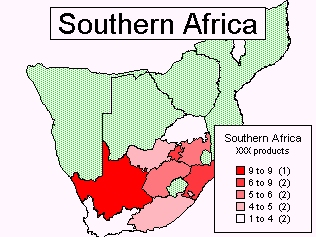
The map below shows values for different
provinces in South Africa for developing XXX products.
When you view this data as a colour-coded map, you can easily
see the trends and relationships in the data.
|
Eastern Cape |
4 |
|
Eastern Transvaal |
5 |
|
Gauteng |
6 |
|
Kwa Zulu Natal |
7 |
|
North West |
4 |
|
Northern Cape |
9 |
|
Northern Transvaal |
2 |
|
Orange Free State |
5 |
|
Western Cape |
1 |

The basic maps provided by the programme
are:
- Australia by State
- Canada by Province
- Europe by Country
- Mexico by State
- Republic of Ireland by County
- Southern Africa by Region
- United Kingdom by County
- United States by State
- World Countries by Country
The map of the South
African Region comprises:
- Botswana
- Eastern Cape
- Eastern Transvaal
- Gauteng
- Kwa Zulu Natal
- Lesotho
- Mozambique
- Namibia
- North West
- Northern Cape
- Northern Transvaal
- Orange Free State
- Swaziland
- Western Cape
- Zimbabwe
When a map is created the names selected
must be the ones of the programme. Some of the names
above are not correct, i.e. there is no Eastern Transvaal,
but they can be corrected on the data map once created.
Information about buying more maps can be
found in the Help menu of the programme. |