|
Open Excel
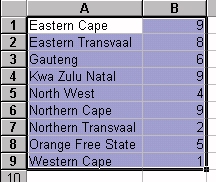
Type in the geographical names
and data you want to graph. The names must be spelt
in the way recognised by the programme.
The geographical names or first
column is used to generate the map and must contain text.
Select the data range you want
to graph.

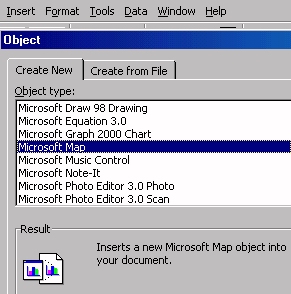
On the menu bar click on Insert,
then Object, then Microsoft Map.

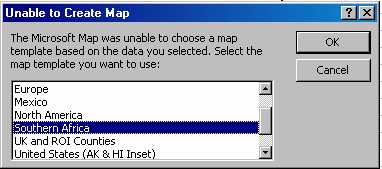
If Excel cannot determine which map to use,
it prompts you to select the desired map.

If the geographical names are
clear, it selects the most suitable map. The data selected,
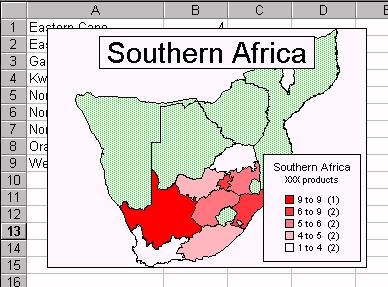
permitted the South African map to be created.

The programme Microsoft Map
opened within Excel with its own menu bar when it created
the maps.

If the map was suitable and
you have finished with the mapping programme, click outside
the map, on the spreadsheet grid lines. The mapping
programme closes and you are left with a graphic representation
of data. The map can be used in programmes in the MS
Office suite.
|