Learn About Concept Maps
Concept maps are an effective way to organize, cluster, and brainstorm ideas. Causal maps are used to illustrate cause-and-effect relationships.
Cluster Maps
These maps are a useful way to help learners cluster and brainstorm ideas and information or show relationships. They can be used as a starting point before beginning a larger project or as a pre-writing activity to be checked by a peer or teacher. This visual representation helps all learners to see their ideas on paper and then use these ideas to write essays, reports, or create multimedia presentations. From simple clusters to more complex ones, learners at all levels and in all subject areas can use clustering strategies to generate ideas.
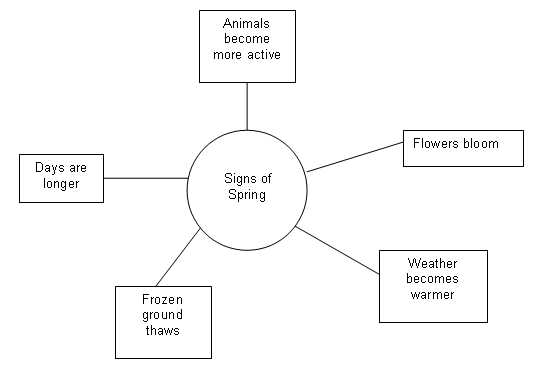
Example Cluster Map:
This cluster map was inspired by the Wave of Spring* Project Plan from Designing Effective Projects.
Causal Maps
Causal maps are a special kind of concept map. These maps help learners create visual representations of cause-and-effect relationships. Analyzing cause-and-effect relationships is important in understanding complex systems, such as historical events, novels, or destruction of animal habitat.
The Seeing Reason Tool promotes cause-and-effect thinking through visual mapping. Learners create visual representations of relationships in a cause-and-effect investigation. These maps make thinking visible and promote collaborative refinement of understanding. In Seeing Reason maps, connections of blue arrows show that the appearance of one factor increases the strength of another, and the width of the arrow indicates the strength of the impact. Red arrows reflect a negative impact. For example, in the map below, Wilbur’s chance to live slightly decreases his insecurity, and Wilbur’s insecurity greatly increases Charlotte’s motherliness.
The Seeing Reason Tool:
- Maps cause-and-effect relationships
- Helps learners analyze complex systems
- Communicates understanding visually and promotes collaborative work
Example Causal Map:

This causal map is taken from the Seeing Reason Project Plan, Charlotte’s Web*.
By using clustering and causal maps, both learners and teachers can visually represent their knowledge and organize their information in logical and meaningful ways. Each map serves its own purpose and can be adapted.
