| |
Budget
Imagine you were going on a trip to another place. How much money would your trip cost? How do you know how much money you should be spending on items like food and fun? To plan a trip, many people
create a budget to figure out how to spend their money.
 |
Plan It |
| |
Create a budget for one person’s three-day trip to your community. Look at the following examples:
Think about the following questions, and discuss your ideas with your
partner. You might want to write a list of your ideas on a sheet of paper.
- What might a visitor to your community spend money on? Try to think of groups of expenses, such as food or entertainment, and not specific items, such as breakfast or museums.
- How much do you think a person would spend each day for each item in your list? Might a visitor only need to pay for items on one or two days? Look at newspapers, advertisements, the Internet, or other places to find costs. Or, make your best guess.
Remember to use the rubric as a guide as you plan, do, review, and share.
For help on how to do certain skills, look at the following groups in the Help Guide:
- Spreadsheets Group 2: Selecting Cells, Rows, and Columns
- Spreadsheets Group 4: Adding and Working with Information
- Spreadsheets Group 5: Changing the Look of Information and Worksheets
- Spreadsheets Group 7: Doing Math
- Spreadsheets Group 8: Making Charts
|
| |
|
 |
Do It |
| |
- Start the spreadsheet software, and open a new, blank spreadsheet.
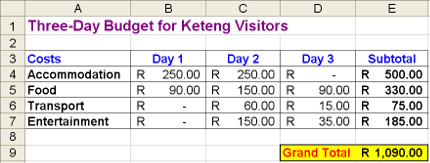
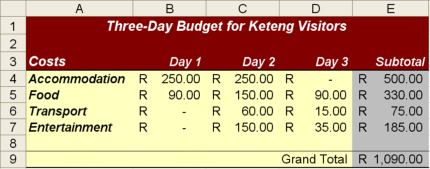
- In cell A1, type a title for your budget.
- In cell A3, type “Costs”. Then in the cells directly below, type the items you wrote on your list. Make sure you put each item in a different cell. Change the column width as needed.
- In cell B3, type “Day 1”. Then type “Day 2” in cell C3 and “Day 3” in cell D3.
- In the cells below the column labels, type the amount of money that a person could expect to spend each day on the items you typed in column A. Make sure that you type the information in the correct cells.
- Change the number format of the cells so the numbers look like currency or money.
- In cell E3, type “Subtotal”. Then in the cell below, insert a Sum function to add the Day 1, Day 2, and Day 3 costs for the first item in your list.
- Fill the Sum function down so there is a subtotal for each cost in
column A.
- Click the empty cell two rows below the last cost amount in column D. Type “Grand Total”, and change the column width as needed.
- In the empty column E cell to the right, insert a Sum function that totals all of the item subtotals in the final column. This is the total amount of money that the visitor can plan on spending while visiting your
community for three days.
- Change the look of the information as needed. You might especially want to make the worksheet title, column labels, cost names, and grand total information stand out. Also, try different alignment options to see which one makes the information easiest to read. If needed, make the columns wider.
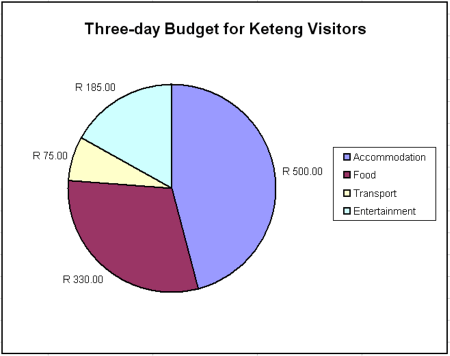
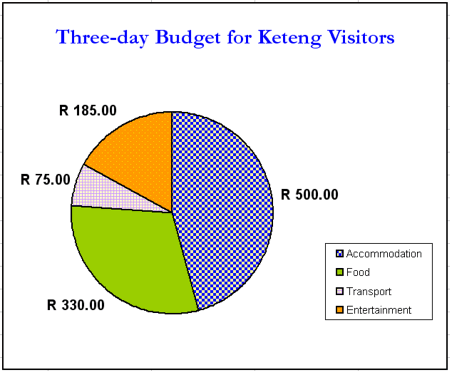
- Select the cost names in column A, hold down the Control key, and then select the subtotal costs in column E. Then, insert a pie chart to show the relationship of each type of cost to the grand total. (For help, see Spreadsheets Skill 8.2: To make a pie chart that shows the relationship of parts to a whole.) Add a title your chart and add the values as data labels. When you are finished, save the chart as a new sheet.
- Save your work as directed.
|
| |
|
 |
Review It |
| |
Look over your budget spreadsheet. Make sure it has the following elements:
- Worksheet with the amount of money visitors to your community can
expect to spend on a three-day trip
- Sum functions that calculate three-day subtotals for each expense as well as a grand total for the entire three-day trip
- Important information such as the title and column labels formatted to stand out, and borders and shading added to the cells to make the
worksheet easy to read
- Pie chart that shows the relationship of each item’s cost to the grand total
If any elements are missing, add them now. If you want, make other changes, as well. Remember to save your work when you are finished.
|
| |
|
 |
Share It |
| |
Be prepared to discuss your answers to the following questions:
- Based on the completed worksheet and chart, on what day will visitors to your community spend the most money? How can you tell?
- How is a pie chart different from other charts that you have made? What other information might you show in a pie chart?
- For what other reasons might you prepare a budget?
|
|